Boston Population and Jobs, 1800s-1850s
This page describes current work in progress to augment the Early Black Boston Digital Almanac CERES site with interactive maps and other media. By augmenting the Almanac through the creation of digitized maps and data sets, it becomes possible to open up new directions of historical inquiry about Boston’s black population over time.
Boston Wards, 1850
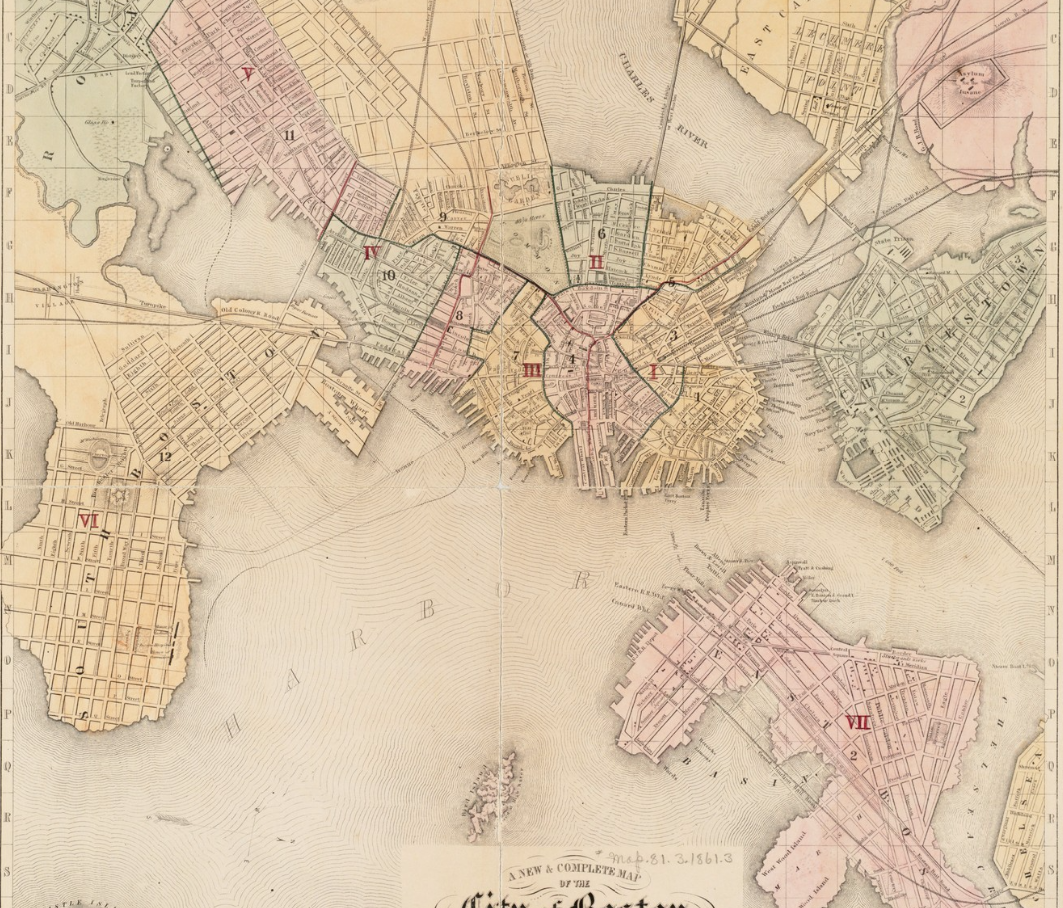 In 1850, the geographic boundaries of wards were changed in the city of Boston. This change is illustrated in the map to the right. In order to create an augmented exhibit showing the geographic distribution of Boston’s black population at this time, we first created a digitized vector map (shapefile) showing this ward distribution, to which we would later attach data attributes such as population. The embedded interactive map, located below, shows the results of this digitization. This map was created using Esri ArcGIS.
Ward 6 (Beacon Hill), 1850
 After creating the outlines for all wards in 1850s Boston, we created a shapefile showing street-level geometries for Ward 6 (Beacon Hill). Using street-level data from digitized census records showing population broken down by age, sex, and race, the goal is to attach those data as attributes to the street-level map to show precisely where the black population was distributed. The map below, created using ArcGIS, shows the street outlines created for Ward 6.
Digitized Census Tables, 1850
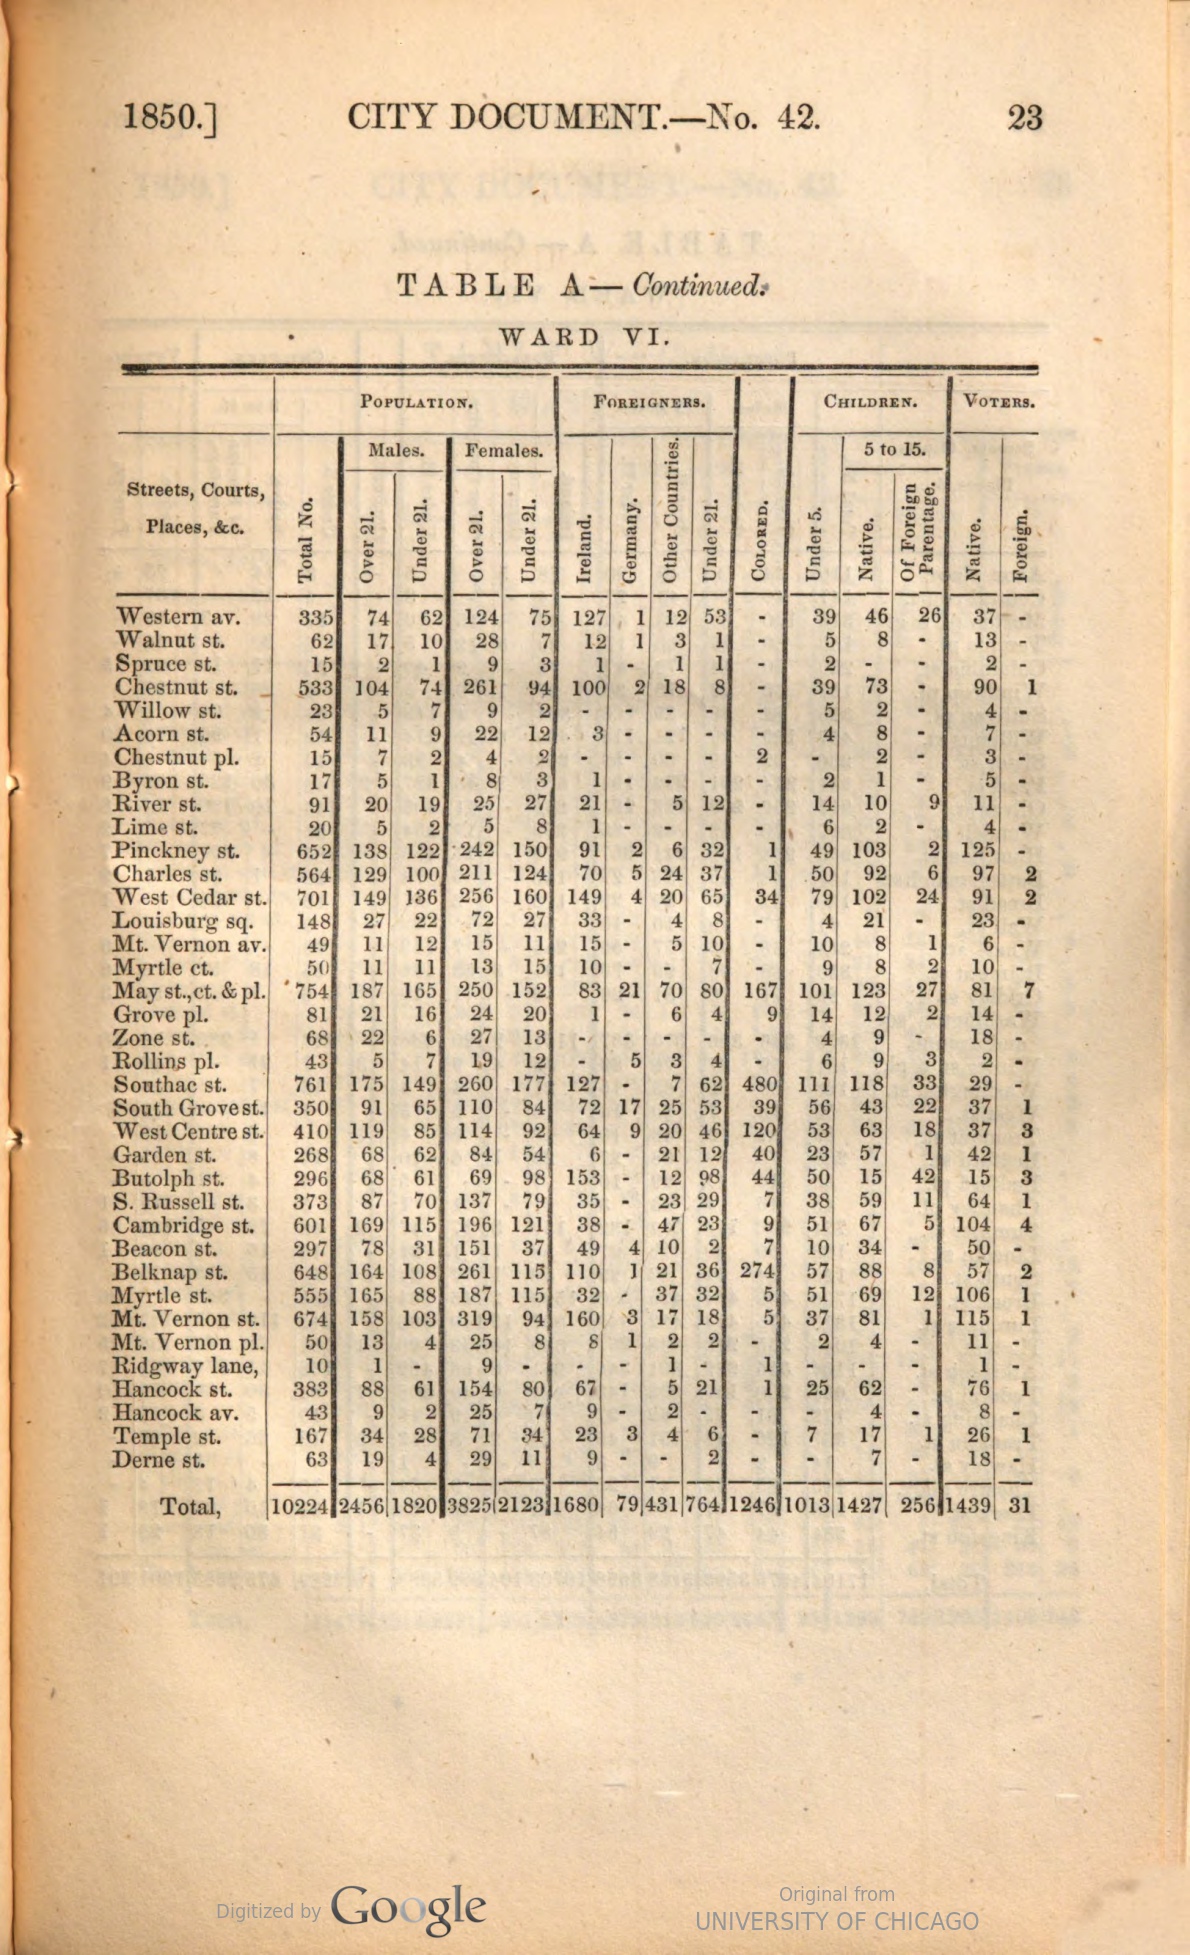
Complete census records are available for the city of Boston in 1850. These records provide population data for Boston faceted by sex, age, nationality, and race at the geographic resolution of wards and streets within wards. Although these records are digitized in image format (as demonstrated at left), the data inside of them are not directly available in a machine-readable format. To make it possible to bind the street-level data in the census tables with our vector maps, we digitized the 1850 Boston census tables for all wards in spreadsheet format. The results of this digitization are shown below, where street-level population data is available for each ward (one ward per tab/sheet).
An interesting discovery from this digitization is that there are some instances in the tables where recorded column totals differ from what the total should be when summed across all the values in their respective columns. Those instances of disagreement are shown in red in the spreadsheet. For the purposes of this project, we have prioritized document accuracy in our transcription over numerical accuracy; however, when we overlay these data on our digitized maps above, we will investigate ways to illustrate those disagreements directly on the map and suggest directions for further inquiry on why these differences are found in the data set.
Next Steps
With our digitized maps and census data tables, our next step is to bind the census data to the maps and create interactive data layers for users to explore on their own. Maps like these can be embedded into future exhibits created for the Early Black Boston Digital Almanac or other BRC projects, demonstrating how different BRC resources, data sets, and media can be melded together to facilitate deeper research.
The full data files produced during this prototype phase are available at via the library’s Digital Repository.